Improve project insights by changing your data analytics approach


In today’s businesses, data is everywhere. Companies are digitalizing rapidly and attempt to be more efficient by using new tools and technologies. In the project controls industry, this is no different. Planning tools not only generate vast amounts of data, but also offer you a way to capture and manage your project data (automatically) by using their API.
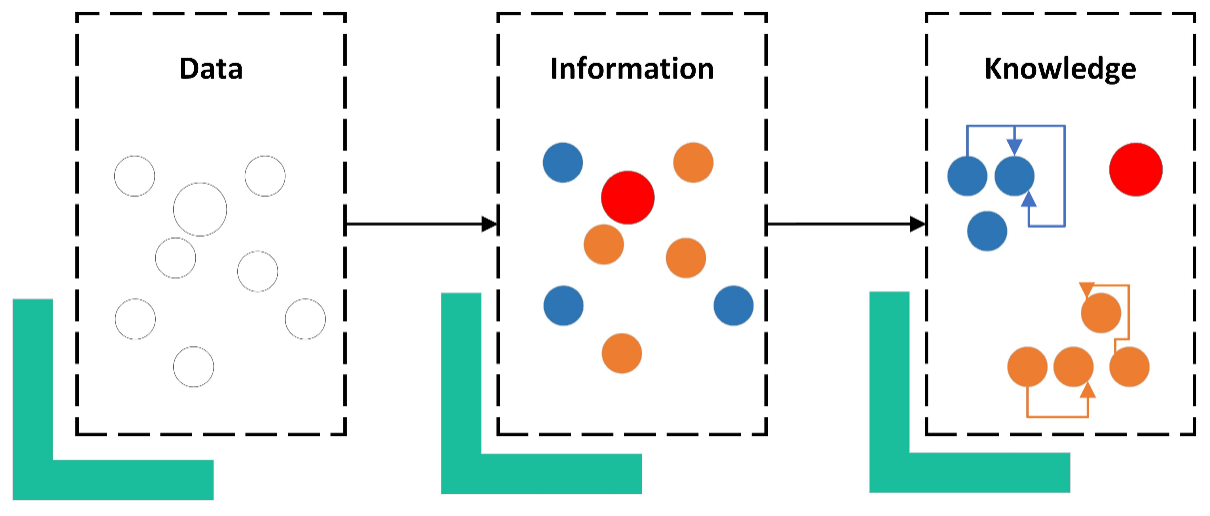
Companies see data as the new gold. They often recognize that, by capturing data, they are able to gain valuable information about the past, the present or even the future. However, there is frequently lack of (adequate) data in the construction industry. A company should start collecting useful data today in order to start using it tomorrow.
Furthermore, a structured data analytics approach is essential to go beyond “merely collecting data”. It is crucial to obtain data that is on the one hand as correct as possible and on the other hand the appropriate data that is able to give an answer to your business challenges. Data analytics is the process of examining data sets in order to find trends and draw conclusions about the information this data contains. If you want to increase value for our projects and solve more business problems by applying project controls techniques, it is good practice to rethink your way of handling project data.
Data analytics in Project Controls
For years, the planning tool has been frequently used as a stand-alone technology where data was entered manually and visualized locally in its own user interface . Today, this is no longer the case. Some frequently seen integrations make a world of difference:
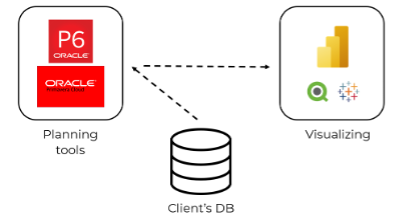
- If you are using scheduling software such as OPC, you can use Oracle’s application programming interface (API) to integrate the Enterprise resource planning (ERP) system or Document management system (DMS) with your planning tool. It allows the project controls engineer to automatically obtain new information into the planning tool, to update the current information and to delete what is not needed anymore. Reversely, it is also possible to send (new) information from the planning tool to the database. This does not only save time, but an automated process also less prone to mistakes while copying.
- On top of this, it might be useful in many cases to link your planning tool directly to your visualizing tool (e.g. PowerBI) with Query. By integrating these two tools, your dashboards are always up to date and it is no longer needed to use Excel files.
Go the extra mile
Although the integrations in the previous section might appear to be an ideal setup that handles your project data issues automatically, there is still some room for improvement. Live dashboards and automatically updated information in your planning tool are good practice because the updated information is more correct, saves time and thus saves money. However, Proove’s expertise in the industry has taught us that some planning information is still not easily available in this setup. For example, what if you would like to:
- Get an overview of the shifting milestone dates throughout the time (milestone trend analysis).
- Get an overview of how expected finish dates of activities or tasks are shifting throughout the time.
- Keep track of when and why activities are delayed, while also recording who is responsible.
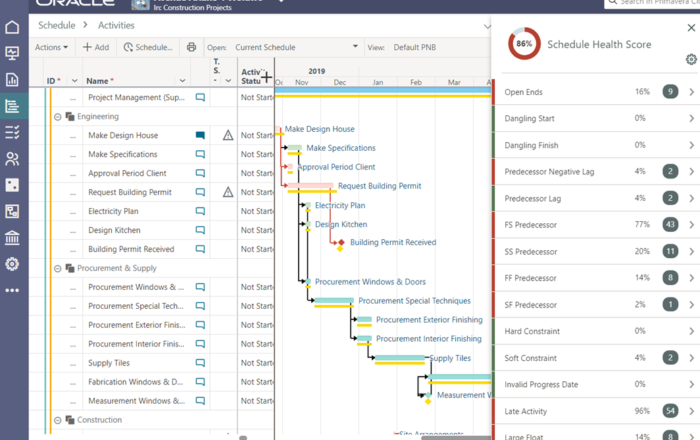
The previous setup allows us to dashboard live data, but accessing the history of the project from start until now remains not easily obtainable and inflexible. In Oracle Primavera Cloud for example, some dashboards are available that provide you a minimalistic milestone trend analysis, but these pre-made dashboards often do not offer enough flexibility to provide all the information that is required by the organization.
A solution that is frequently applied by planning engineers is exporting data to excel and using the paste-values option to save actualized data every time period. This manual approach makes your data more accessible, but is labor intensive and, moreover, prone to mistakes. Much valuable project information gets lost in the process and management questions remain unresolved.
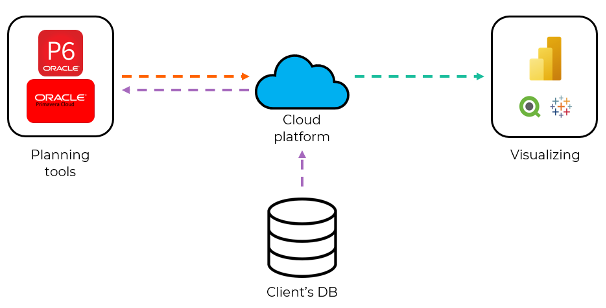
A more desirable approach of managing data would be to use a platform to store the data periodically yourself. The project benefits from this method in multiple ways:
- The integration between the database and the planning tool can be ran in the cloud with a timer trigger. This has multiple advantages:
- You can specify when your code should run. The platform takes care of the rest.
- When you are changing your code, platforms such as Azure allow you to run the previous version until redeployment.
- It allows more collaboration.
- It is a scalable solution and you pay what you use.
- In a SQL database, historical project data can be saved for activities, tasks, constraints, reasons, etc. in a structured way. Adding a timestamp to each row allows you to repetitively obtain information from time periods and thus eventually analyze differences between these points in time. Storing the data yourself makes it easily accessible and flexible to use.
- Cloud platforms are very convenient to link with visualizing tools.
Proove's tailor made solutions
At Proove, we realize that there is not one solution that fits all. Although the Cloud platform approach offers multiple benefits to larger, more complex projects, it might be overkill in smaller, more straightforward projects.
It is our expertise to find the correct project approach, which varies for example on:
- Project size
- Industry
- Budget
- The specific challenges of the client and need for information
If you have any questions, feel free to contact us.

